A Focus on Spending and Habits
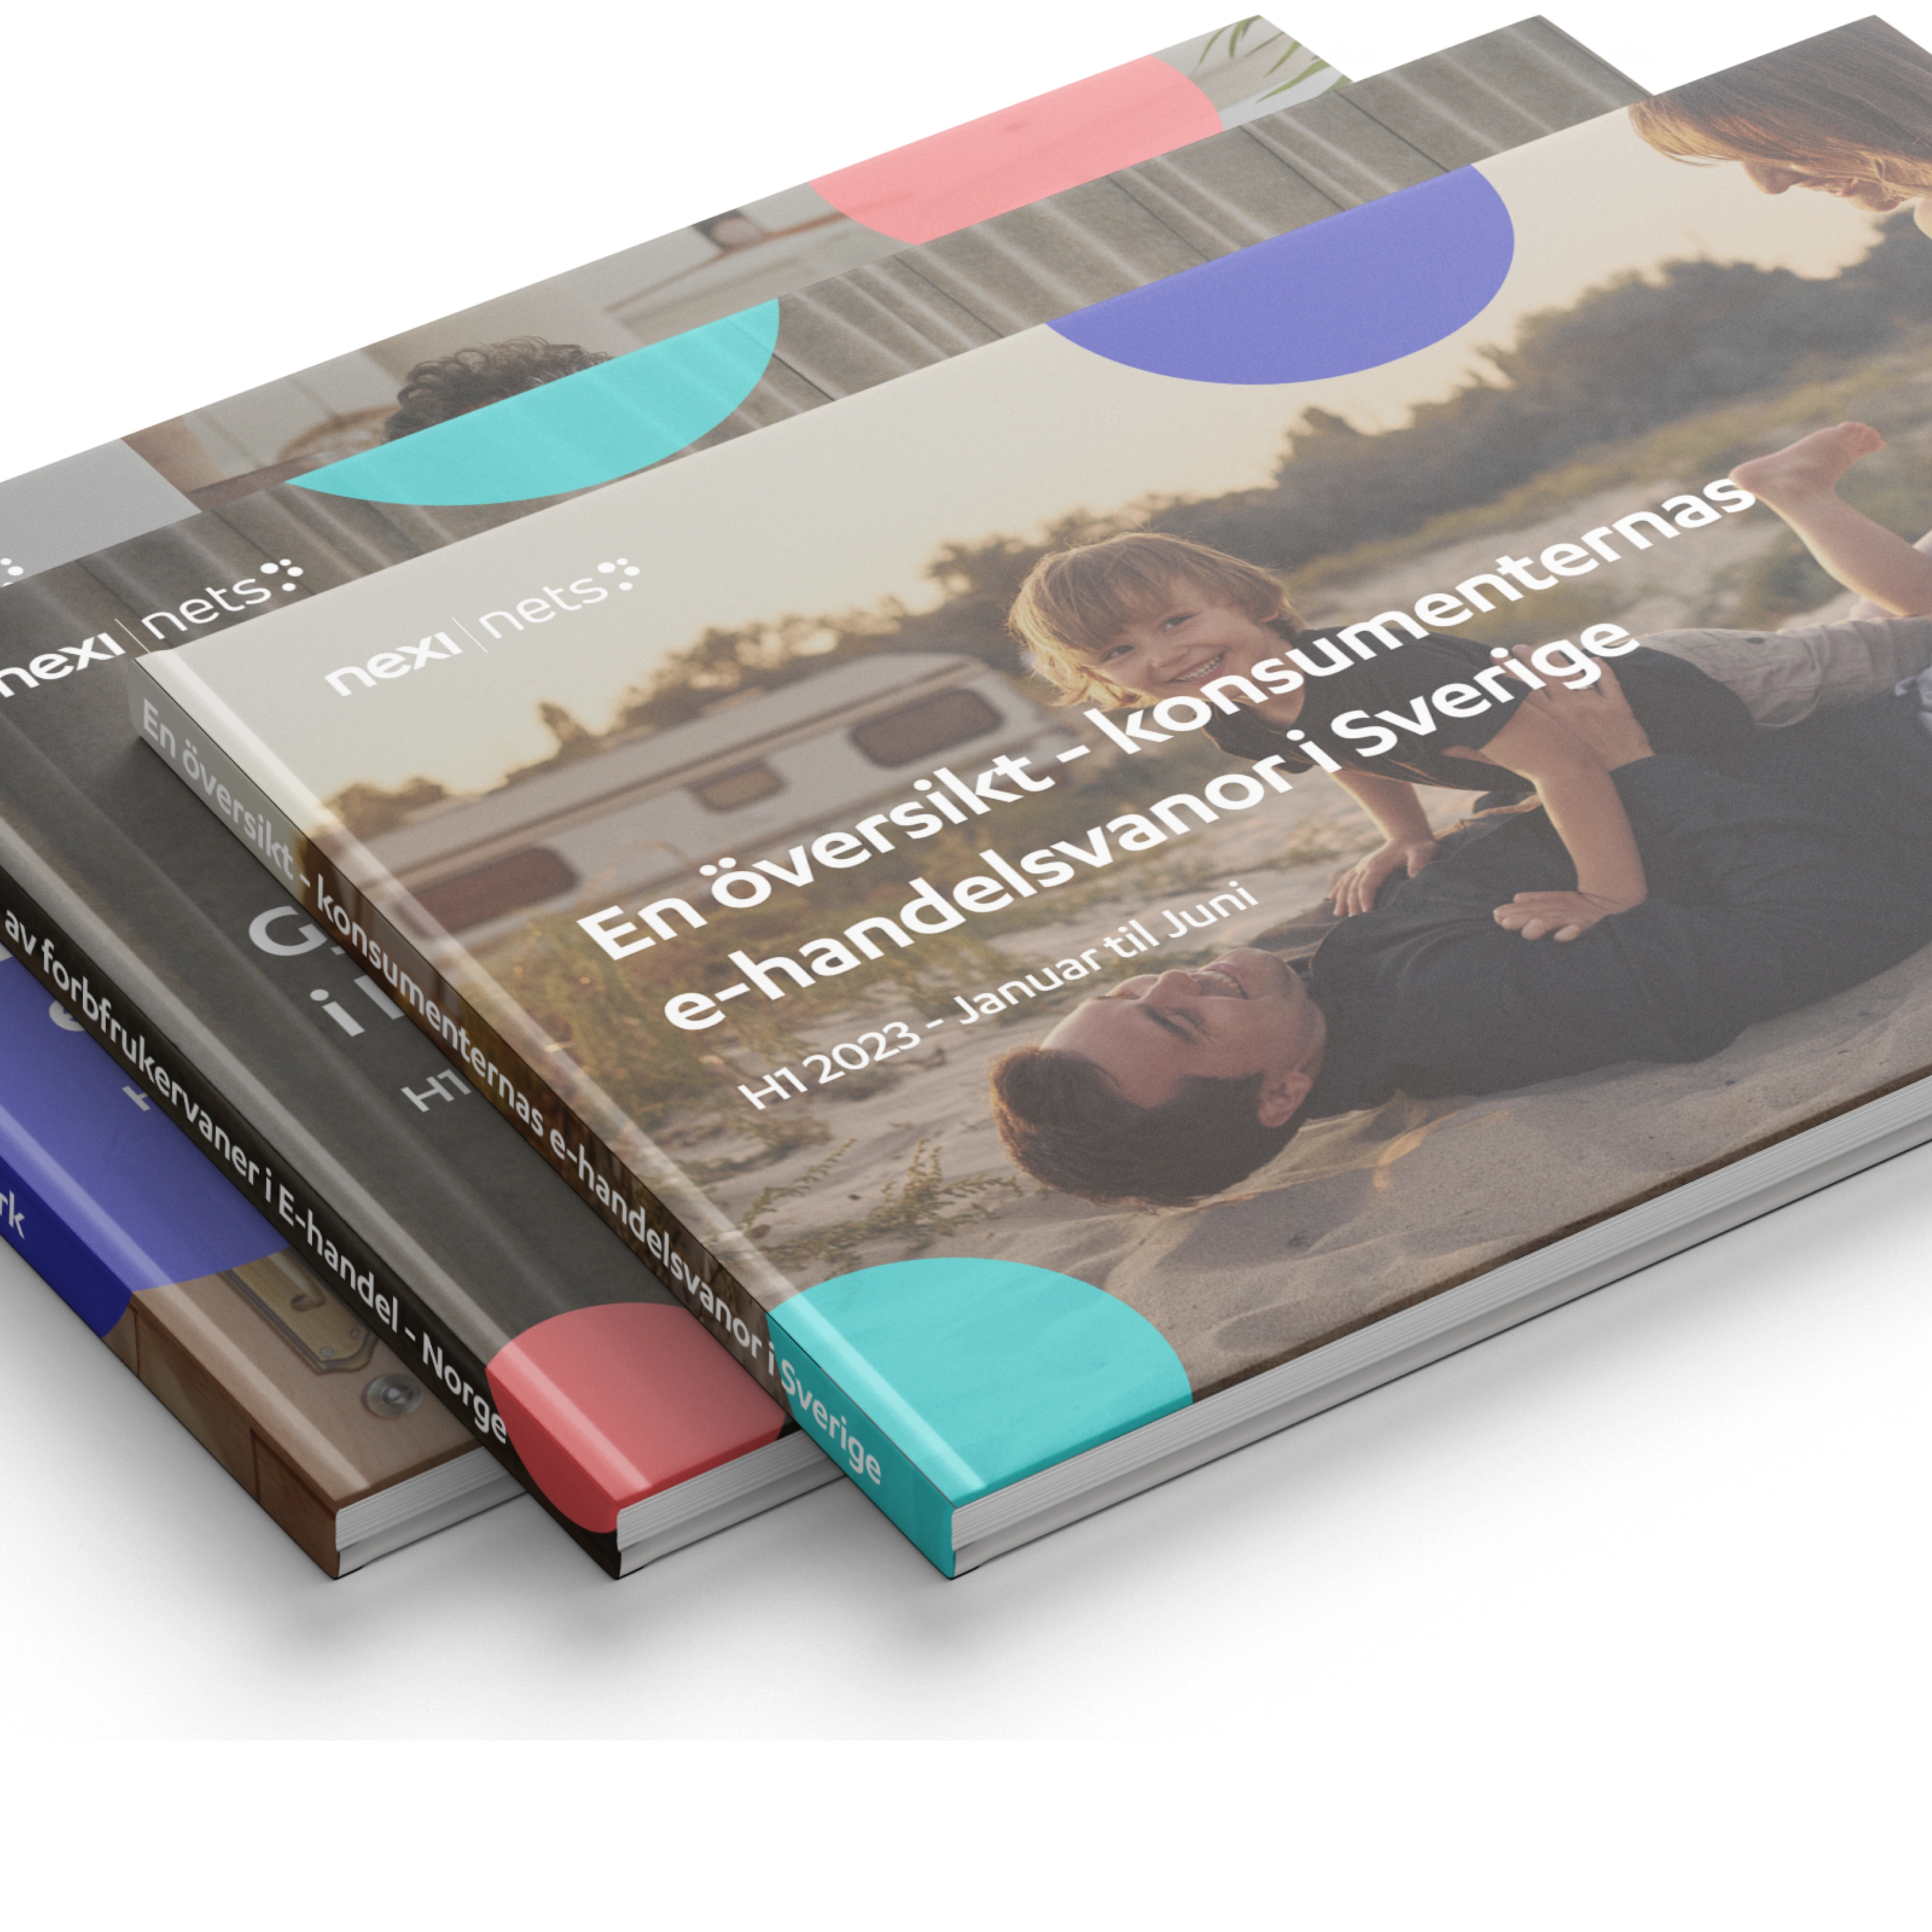
Our Ecommerce Consumer Habits Review is now available for each of the Nordic markets: Sweden, Norway, and Denmark. In each country’s half year summary, we present an exploration of the evolving ecommerce landscape, as we highlight changes in monthly spending habits in the categories of physical goods, services, and travel. This research effort is the first of three focusing on Scandinavian consumers.
Each half year summary is based on two main parameters: spending and monthly habits. First, the “Growth and Spending Comparison” examines consumption trends in ecommerce, providing insights into the driving forces behind its success. Next, “Changes in Consumption” delves into how the digital age, the pandemic, and shifting attitudes about travel have influenced spending habits in the travel, physical goods, and services categories.

Online Spending: Travel Wins
The lingering effects of the pandemic and inflation challenges in Europe had a massive impact on customer behavior in 2022. However, enough time has now passed to start seeing a return to “normal”— atleast where online shopping is concerned. According to our research, when comparing the first half of 2022 to the first half of 2023, we see that overall online spending in terms of total currency grew similarly in each of the three markets: +18% (Denmark), +17% (Norway), and +16% (Sweden). Scandinavian consumers are spending more, yes.
Consumers in the Nordics are showing us that their greatest area of interest is travel, with Swedes showing the greatest enthusiasm to pack their suitcases and spend their kronor: +39% (Denmark), +42% (Norway), and +55% (Sweden). The renewed interest in travel has grabbed a larger share of their wallets, at the “expense” of what they spend on physical goods and services. We see that from changes comparing the first half of 2022 to the same time period in 2023:
– In Denmark, physical goods spending dropped to 36% of total spending while services spending remained steady at 16%.
– In Norway, physical goods spending dropped to 31% of the total and services spending dropped to 18%.
– In Sweden, physical goods spending dropped to 37% while services dropped slightly to 15%.

Top 3 Spending Habits as “Share of Wallet”
Of course, there are different “things” within each of the travel, physical goods, and services categories on which consumers decide to spend their money. As we zoom in on the top three “habits”, labels include: groceries, clothes, beauty products, pharmacy items, ‘white goods’, and so on. And yes, there are some shifts in both total spending, as you will see in the below share of wallet from 2022 to 2023. All details are within the white papers but as a quick overview, let’s look at the physical goods and the services categories.
Habits– or National Character?
When examining what each country’s online spending looks like, there are top habits that .. dare we say.. paint quite a picture of… national character. Take a look.
In the first half of 2023, in the physical goods category, we see that Norwegians spend the most of their total online shopping on clothing and also on beauty products, compared to their neighbors. Danes “take the cake” with takeaway food spending while Swedes seriously spend on pharmacy products. Interesting.
– Danes – the fashionable foodies? They are spending most of their money on clothes (28.3%), takeaway food (20.2%), beauty products (14.8%) with a significant loss of focus on clothes and a swap of spending on groceries for beauty.
– Norwegians – the image-conscious health nuts? They are spending most of their money on clothes (32.2%), beauty products (20.2%), and pharmacy items (16.8%); this top three constellation shows us their significantly increased passion for clothing and beauty products while their taste for takeaway food seems to have been replaced by a greater preference for pharmacy items.
– Swedes– the health-conscious fashionistas? They are spending most of their money on pharmacy items (37.6%), clothes (27.2%), and beauty products (16.8%), and the changes year over year are not significant.
Somewhat Similar Scandinavians?
In the first half of 2023, in the services category, the people in the Nordics show us that they love their steaming services and entertainment. But there is a twist: while Danes are preoccupied with exercise, Norwegians prefer to read— and Swedes prefer to play it safe by insuring… well, practically everything.
– Danes are spending most of their money on streaming services (54.4%), tickets (23.4%), and gym membership (16.9%). They show a significant increase year over year in ticket purchases and just a slight increase in gym memberships.
– Norwegians are also spending most of their money on streaming services (57.7%) and tickets (27.4%). However, they add in digital media (23.7%). They show a significant drop year over year in their interest in streaming services— though it is still a top pastime.
– Swedes are spending most of their money on streaming services (57.7%) too, as well as, insurance (22.2%) and tickets (19.7%). The first two labels show just a slight increase year over year.

Download the Half-Year Summaries, Get Smarter
There are key differences between the markets in terms of what Danes, Norwegians, and Swedes spend their money on, and it is interesting to see where the money is shifting both among the categories of travel, physical goods, and services— and within them with the various labels. As a merchant, understanding what your customers are spending on (and what they no longer are prioritizing) will help you stay ahead of your competition— and even adapt your offerings.
Join us on our journey as we uncover the evolving dynamics of ecommerce sector.
Download the half year summary insights here:
—
Each whitepaper is based on results from surveys conducted by Kantar on behalf of Nets in the form of 50 weekly interviews among internet users in Sweden (1,732), Norway (1,727), and Denmark (1,669) from January until June 2023, respectively. Participants are age 18-79 having internet access, and each response was weighted by age, gender, and region.

Samara H. Johansson
Content Manager, Nets E-Commerce
With 15+ years of experience in strategic marketing and communications roles, for Nets I focus on presenting e-commerce market insights in a way that is easy to understand and practical.
- Topics


