Knowledge is power
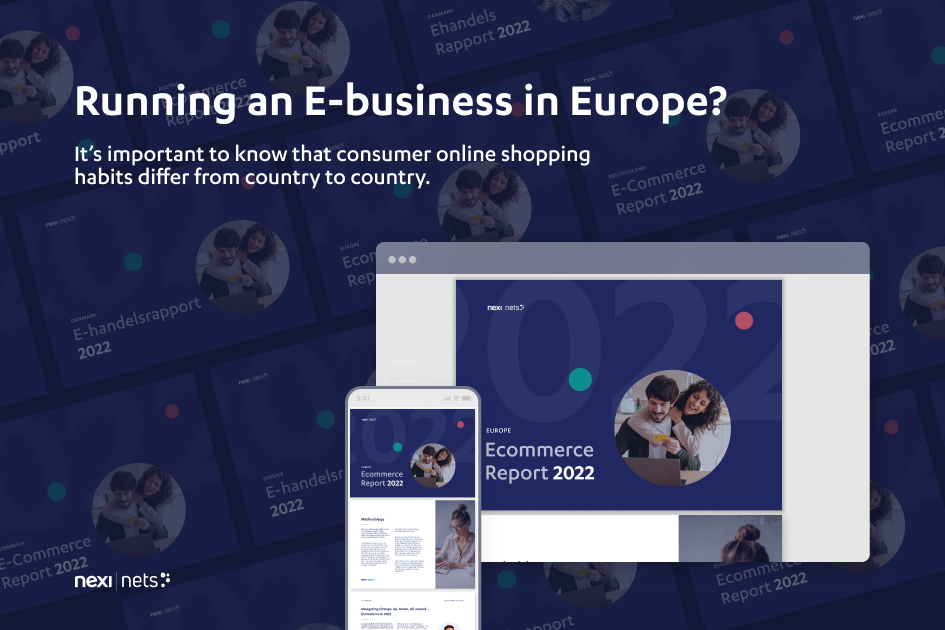
The 2022 European Ecommerce report is now available! We’ve published this report for 15 years, with a unique blend of hard data and survey of over 10,000 consumers to give a rounded picture of the evolution of ecommerce in Europe.
We believe our report gives a tangible and actionable view of: what Europeans buy; how they like to pay for their purchases; what services they seek when buying online; and more. All with the intention of revealing trends that can be understood— and then “captured”, to make wiser business decisions as merchants, webshop platforms, agencies and partners.
The vast majority of people shop online, even as penetration as a total percentage of overall commerce is low, it is constantly growing. COVID created another distortion, creating a once-in-a-lifetime shift to online, and now post-COVID, in some countries (for example, in the Nordics) this has returned to growth rates seen pre-COVID, but in other countries (like Italy) ecommerce has remained at historic highs.
Behind the overall hard data you can obtain yourselves from local statistics offices, the more interesting trends are what sit behind the numbers, and you can only get this by talking to shoppers: What is being purchased by all of us? Has this changed over time? And importantly- what makes us click “pay” when we’re ready? The answers may surprise you and of course differ from country to country.
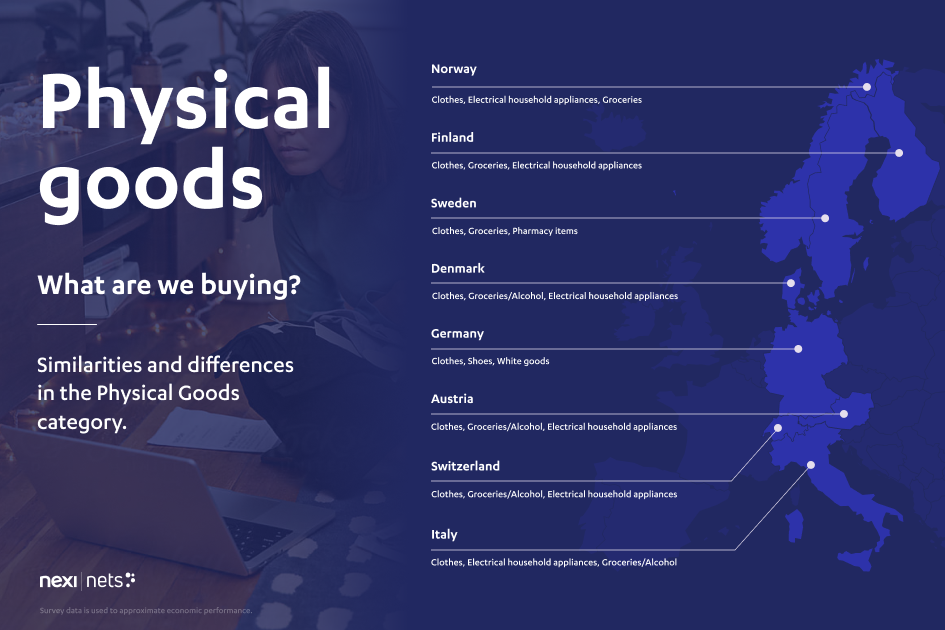
Physical Goods: clothes instead of computers. Pizza as well as painkillers

Clothes, clothes, clothes. That’s what’s on the top of the shopping list when we look at what type of physical goods Europeans buy online. Danes frequently buy clothes- yes, but takeaway food and groceries take top places on the monthly shopping list, too. Purchasing takeaway food online is also common in Norway and Finland. Purchases from the online pharmacy is a new favourite across the board, as this category appears in the top three places in terms of monthly expenditures, in the Nordics, as well as DACH and Italy.
The data also shows an interesting mix of consumer sentiment and economic performance. Consumers report they are clearly going back to enjoying physical spaces and stores, shopping less online and instead partly returning to buying physical goods. Norwegians and Danes report the greatest changes in spend behaviour (-18% and -15%, respectively). The other markets hover around -7%, with Germans saying that they changed spend behaviour the least at 3%. See here:
- Sweden -7%
- Norway -18%
- Denmark -15%
- Finland -7%
- Germany -3%
- Austria -7%
- Switzerland -5%
- Italy -7%
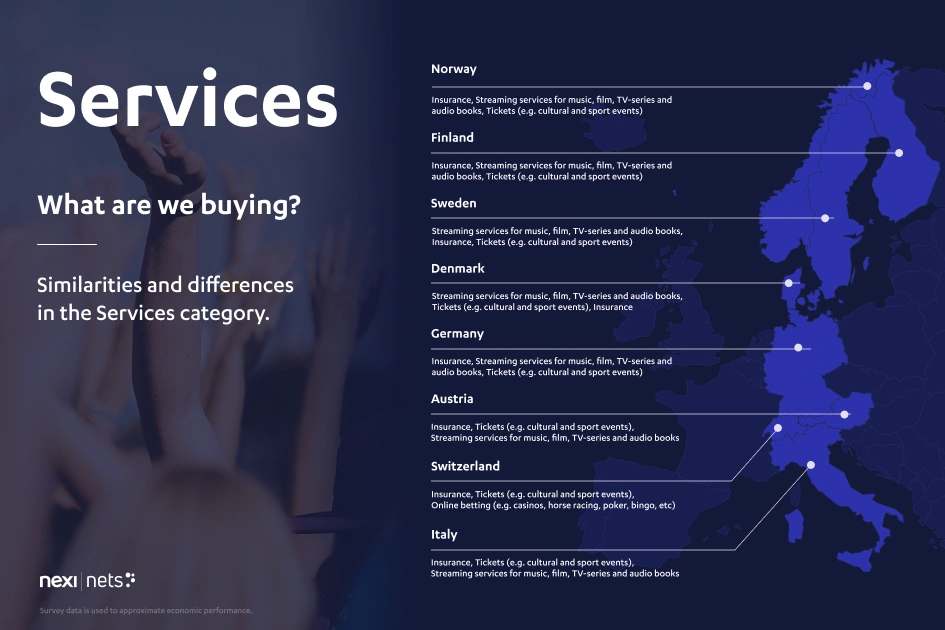
Services: insurance, sports and subscriptions

Compared to 2021 levels, consumers report spending more on streaming services in Denmark and Sweden. As for the rest of the countries, consumers there try to ensure nothing untoward will spoil their fun when they do go out and about: they spend on insurance the most. As far as monthly spending goes, there certainly are some very distinct preferences when we look at the three most popular items on the shopping receipt. Norwegians like to be up-to-date with the news, while Germans, Austrians, and Finns like be kept in the loop with sporting and betting results. Swedes seem to be the most socially conscious, with a high tendency to contribute to charity on a regular basis.
It’s reassuring to see that overall spending in the services category compared to 2021 has risen overall post-pandemic— most dramatically in Austria and less dramatically in Italy:
- Sweden +10%
- Norway +17%
- Denmark +10%
- Finland +11%
- Germany +16%
- Austria +39%
- Switzerland +19%
- Italy +3%
Travel: Flights to sun and fun rebounded strongly, but there’s an ongoing shift to cycling and other carbon-neutral travel

It’s no surprise that post-COVID, one of the biggest changes is in travel spending, where consumers report a more than 50% increase across all countries, since lockdown and restrictions have eased. Spending on flights, followed by hotels tops the list for Norway, Sweden, Finland, and Austria— while spending on hotels are the top concern for consumers in Italy, Switzerland, and Germany. And Danes— they prioritize travel packages in general, but on a monthly basis, they spend the most money on their bicycles. Italians and Finns, however, must dislike looking for parking, since the top of their monthly spending receipts show they buy tickets and monthly passes for public transport most often.
Research shows that that Finns and Austrians are bitten by the travel bug more times than the rest (+110% and +119%, respectively) while Italians prefer to perhaps enjoy la dolce vita at home, as demonstrated by the lowest level (+9%):
- Sweden +87%
- Norway +56%
- Denmark +68%
- Finland +110%
- Germany +75%
- Austria +119%
- Switzerland +80%
- Italy +9%
Regardless of the slight differences between consumers’ spending habits and priorities, we do not foresee that interest in seeing the world and just relaxing will change any time soon. And this is great news for merchants who sell items and services in the travel industry and even those merchants who offer items related to this favorite pastime.
Under the basket…how do Europeans prefer to shop online?

All respondents point to convenience (the top choice) when asked why they shop online, followed by lower prices and a larger range of products being available; Swiss consumers also remarked they do not like being dependent on physical store opening hours while Italian consumers express time savings as crucial. These answers are no surprise— but for merchants this is a reminder to keep things simple and functional for customers. And of course, time is money. High shipping prices, complicated returns, and customs hassles will cost both time and money, as all respondents from the countries surveyed agree. (Except the Italians, who care less about customs hassles and more about fast deliveries.)
But do consumers trust their local post office? Seems the answer is yes for consumers in Italy and DACH countries, who choose to get their deliveries at home. In Nordic countries, however, consumers state that the most preferred way is the pick-up option. It’s not a matter of trust alone, though. The research shows Nordic consumers point to home delivery costing more and being inconvenient (as they would need to be home to receive their packages.) For merchants this means to be aware that “convenience” is not just in payment method or the shopping experience, but in being clear and setting expectations regarding the shipping and delivery of products and services.
And what about payment habits… and the future?

European consumers look for simple, secure, and fast payment methods when shopping online. And they seek merchants that offer them multiple ways to pay and for methods in which they are accustomed to using— from local or global e-wallets to debit or credit cards to invoices.
The report shows how consumers pay for goods. While e-wallets and invoice-on-delivery are popular payment methods in Germany, Italians favor paying by debit cards or prepaid cards, Paypal and they show a preference for good old-fashioned cash. Credit cards and invoices are the top two methods that consumers report using in both Switzerland and Austria. The countries in the Nordics, on the other hand, are used to paying by cards using domestic schemes like Dankort in Denmark, and domestic wallets like MobilePay, Swish and Vipps.
And what about future trends? Consumers are interested and aware of upcoming industry developments when it comes to online shopping. These include: virtual and augmented reality; biometric identification; and package delivery by drone. But there is no rush for you to adapt your ecommerce operation (at least for now.)
A yearly tradition of insight

The 2022 Ecommerce Reports are based on results from surveys conducted by Kantar on behalf of Nexi, in the form of 50 weekly interviews among 10,200 internet users, aged 18-79, from January to July 2022. Respondents throughout Norway, Denmark, Finland, Sweden, Switzerland, Germany, Austria and Italy participated in the research. The research report is based on two main parameters: expenditure and habits.
Expenditure is a parameter based on survey respondent response on approximation of money spent on specific category over the previous 28 days. Estimates of total online consumption are based on the median value times the number of people shopping online in each category. The advantage of this method is that the median is less sensitive to extreme fluctuations as to provide a more accurate picture of typical consumer behaviour.
Habits of each user were based on their shopping activity over the previous 28 days. Throughout the survey, the majority of questions offered possiblity to choose multiple answers, and this was then calculated to represent online shopping habits.
We offer the following reports in English:

Omar Haque
CEO, Nets E-Commerce- Topics


